
Home  Products
 System software
 SiManager-SI
 Products
 System software
 SiManager-SI
SiManager-SI
Project group management
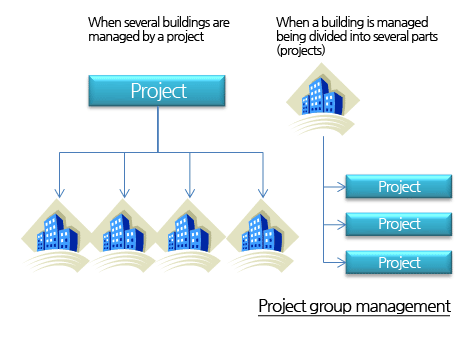
- Buildings can be grouped by a project irrespective of their locations and the objects of management can be monitored and controlled.
- Several buildings can be managed as one project.
- The objects of management can be divided into several parts in a building and each of them can be managed as a project.
Dual system
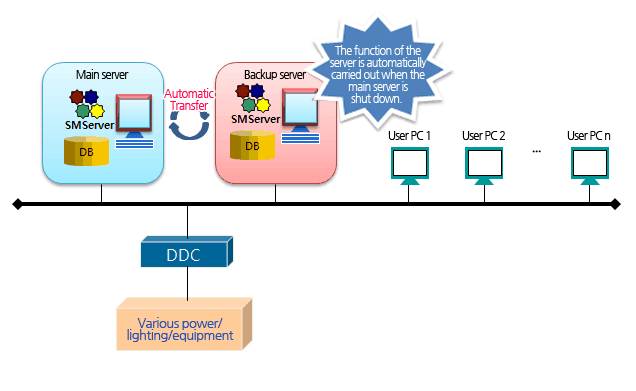
- Non-stop dualized service is possible through operation of the backup server when the main server goes defective.
- The main server saves backup data in the backup server at a predetermined cycle, and the server function is automatically switched to and carried out by the backup server when the main server goes defective.
- Each client can carry out the task without stopping by re-accessing the backup server in accordance with the guide message when the main server goes defective.
Quick editing and dual monitor
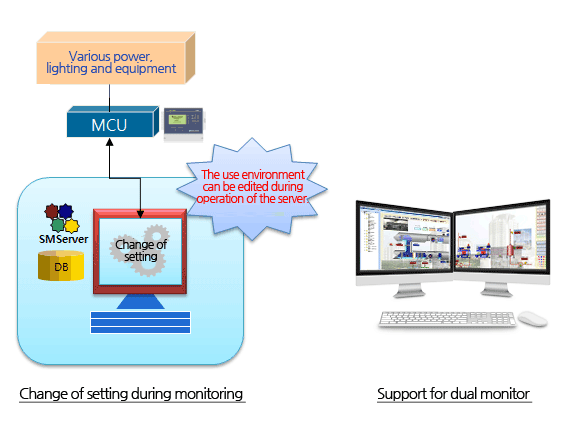
- Quick editing during server operation : An operational vacuum can be minimized as various quick editing works can be done as follows without shutting down the server.
- Graphic editing
- Tag attribute change
- Trend attribute change
- Schedule editing
- Camera setting change
- Support for dual monitor : Support for dual monitor: Monitoring and control can be carried out by executing several operating screens on two monitors at the same time using one computer.
Graphic monitoring and control (Graphic Map)
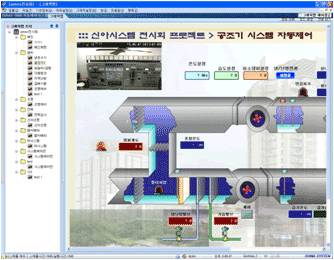
- The system can be vividly and realistically monitored and controlled through 3-dimensional graphics.
- The site situation can be checked with image and sound in real-time by arranging the camera images on the graphic screen.
- Diverse objects (line, figure, text, picture, camera, and graph) and graphical effects (appearance, flickering, figure change, tag control, page operation, vertical/horizontal – change/movement/filling) can be used to prepare highly legible graphic monitoring screens which fit the use and the purpose.
Text monitoring and control (Text Map)
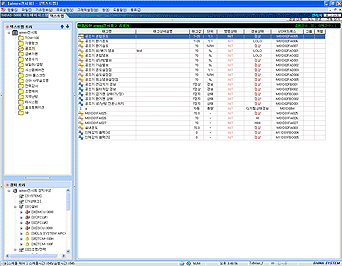
- The Text Map is a basic system map and is comprised of a device tree generated by the device manager and a user tree constructed by the user.
- The Text Map can be conveniently used for real-time monitoring function of tag and during individual or batch control.
- The operator can organize the text map tree to fit the use and function, and can set the tag attribute, inquire about tag history and register schedule by tag.
- Being organized in the form of tree view and list of the Windows Explorer structure, it has good accessibility and legibility, and a list can be constructed using the drag & drop method.
Real-time trend monitoring (Trend Map)
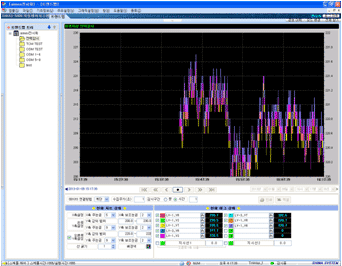
- The real-time value of the tag registered by the operator is compared in the form of a graph and monitored.
- The tag value is automatically reflected on the trend graph in accordance with the collection cycle set by the operator.
- Ten tags by each trend can be monitored at the same time, and trend management by group can be easily done through the Trend Tree.
- As trends of two tags with ranges different from each other can be monitored at the same time using the right Y-axis, the analog tag and digital tag can be monitored at the same time making analysis easy when an event occurs.
- A past trend can be viewed again using the trend screen movement button, and the detailed value of the relevant position can be checked by clicking a specific position.
Schedule setting and control (Schedule Map)
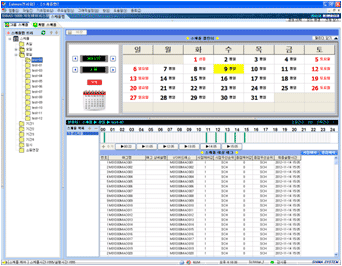
- A schedule can be easily set using the calendar and time bar.
- A large amount of schedule can be easily registered using the schedule models (groups) such as holiday, weekday, specific day of the week, and user definition.
- An individual tag schedule function can be used to intensively manage distinguished tags in accordance with use.
- Schedules can be copies and moved using the drag & drop method.
Report preparation (Report Map)
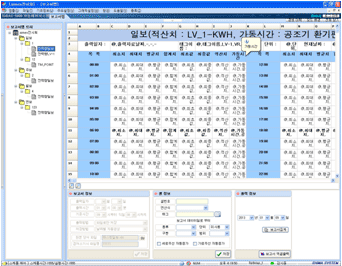
- Diverse report forms prepared in Excel (daily report, weekly report, annual report, etc.) can be registered and used.
- Setup information (tag and object value) designated to each cell can be used and the result of the registered report can be previewed.
- Also, report files can be automatically generated and printed using the automatic output function.
- The expression value of tag by time band (minimum value, maximum value, average, summation, etc.) can be easily and quickly set during cell setting using the longitudinal/transversal automatic increase function and sell reproduction function.
IP camera monitoring (Camera Map)
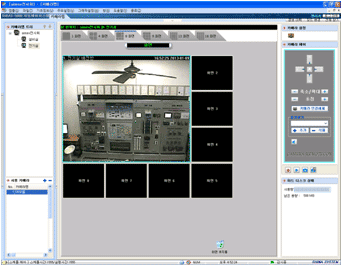
- The on-site situation can be monitored in real-time by registering the camera.
- Movement of the monitoring position, zoom in/zoom out, and moving picture storage and capture functions are provided.
- The screen can be arranged in 6 forms using the cameras registered in the camera setting by group in the camera tree.
- Screens of the cameras can be registered and moved using the drag & drop method.
Inquiry about tag history
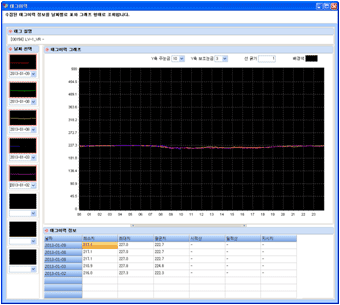
- Inquiries can be made about the collected tag data by hour or by day in the forms of graphs and tables.
- For analog points, the minimum, maximum, average and reading are displayed and, for digital points, accumulated operation time by hour and day are displayed.
- Comparative inquiry by date can be made by adding up to 8 inquiry dates.
- The detailed graph of the relevant day by time band can be inquired about by double clicking the position of a specific time band in the graph initially inquired about by day.
Alarm generation and inquiry
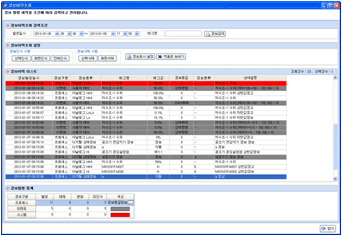
- The current situation of the system operation can be informed by an alarm rating and detailed classification using diverse media in accordance with the user setting.
- Inquiries about alarm history can be utilized for diagnosis and management of the system condition.
- The alarm history can be shown being divided into process, event or system.
- The indication of the alarm can be changed through recognition and deletion processes.
- Only the set classification and items can be displayed using the filtering function.
Device configuration (Device Manager)
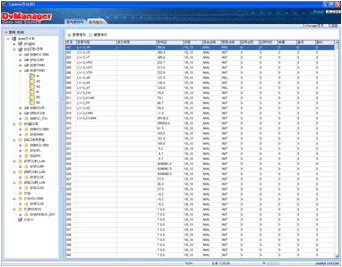
- DvManager is a device setup tool used to set each equipment to carry out the independent function for itself by setting device compositions of the network port of all the devices, input/output definition for each device, and local schedule input.
- DvManager supports a multi-port structure as well as a diverse communication method by port (RS-232, RS-485, and TCP/IP) and protocols (SE-Net, CU-Net, DDE, MODBUS, OPC, XNET, etc.) making system integration with diverse devices including those of other companies easy.
Control logic preparation (Logic Builder)
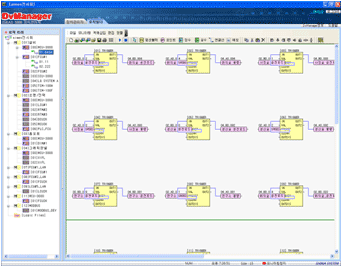
- For the devices in which control logic can be executed (FCU and MCU), the logic can be easily implemented and downloaded to the device through the graphic editing environment. (About 100 functions are provided.)
- The logic prepared can be immediately verified through real-time monitoring and tuning.
- Control logic is simply implemented by drag & drop method using objects (function block, point, integer, real number, and connection line).


